Survey Design
The ALFALFA survey was an extragalactic spectral line survey (aimed at observing primarily the HI line at 21cm or 1420.4 MHz) conducted with the Arecibo telescope, observing about a fifth of the sky with almost 5000 hours of telescope time between Feb 4, 2005 and Oct 26, 2012.
The Arecibo Telescope was, at the time, the world's most sensitive radio telescope at L-band (1.4 GHz), with a 305 m (1,000 ft) spherical reflector dish built into a natural sinkhole and a cable-mount steerable receiver hung 150m above the dish. This design limited observations to sky located within 18 degrees of zenith; given Arecibo’s location at 18 degrees north latitude in Puerto Rico, this meant a practical limitation to declinations between 0 and 36 degrees.
The installation of the seven-horn Arecibo L-band Feed Array (ALFA) in 2004 allowed for a dramatic improvement in survey speed over previously available L-band feeds. Thus, the ALFALFA survey was designed to cover all areas of sky visible to Arecibo at high galactic latitude (i.e. above the galactic plane to minimize foreground extinction for optical cross-matches), which ends up being about 7000 sq degrees or about a fifth of the total sky (see section 2 of Haynes et al. 2018, and references therein for more details).
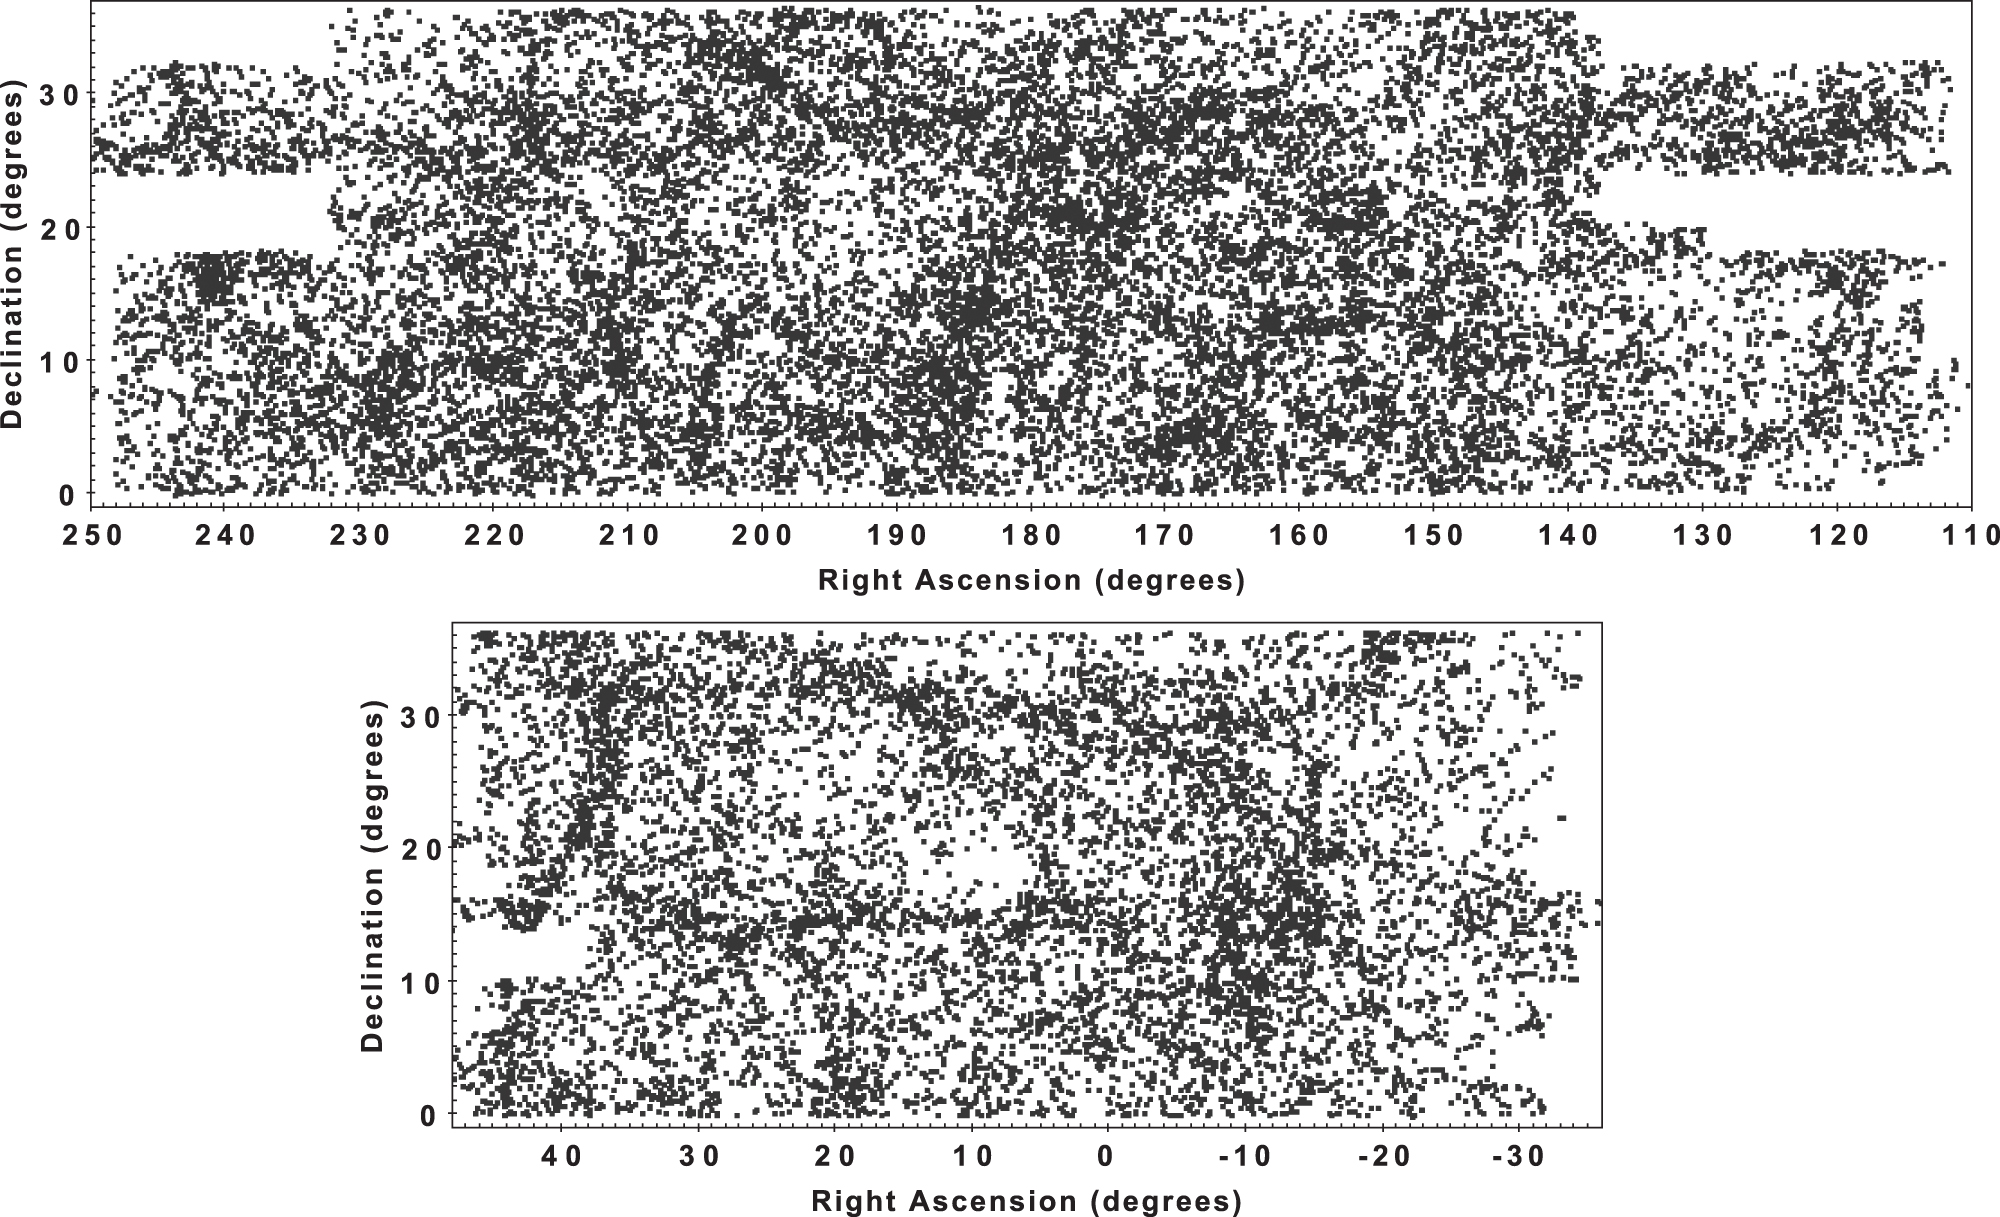
The ALFALFA bandpass covered 1345-1435 MHz, which equates to the HI line being emitted by galaxies with recessional velocities of -2000 to +17500 km/s (z=0-0.058, or a distance of D ~ 250 Mpc; and accounting for blueshifted emission from galaxies in the Virgo cluster). The spectrum was sampled with 4096 channels, resulting in 5 km/s (=23 kHz) channels over the 100 MHz bandpass, and a spectral resolution of two channels (=10km/s or 46 kHz). As described below, the survey covered 7000 square degrees of Northern Hemisphere sky, producing a detection catalog and associated datacubes with an angular resolution (= beam FWHM) of 4 arcmin and a sensitivity of 2-4 mJy/beam.
ALFALFA was conducted as a non-targeted survey, scanning entire regions of the sky regardless of the presence of known galaxies. At each sky position the entire frequency range was searched for line emission. These drift scan observations totaled 4741.5 hours over nearly 8 years and 808 runs, and involved 99 different observers.
In detail, ALFALFA employed a two pass drift scan technique, where for each pass, the telescope was pointed at a specific declination and right ascension (RA) starting point, and then (mostly) not moved. The rotation of the Earth causes the sky to “drift” overhead making scans at fixed (current epoch) declination and across RA. This technique is described in more detail in this page describing the ”ALFALFA observing mode” and in Giovanelli et al. 2005. The two-pass drift scan technique results in a total effective integration time of ~40 seconds, given the ALFA beam size of approximately 3 arcminutes. Full details of the ALFA beam and sensitivity are given in [section/ reference]. The data acquisition sequence was interrupted every 600 s to allow the injection of a calibration noise diode for 1 s and to make minor pointing corrections to ensure constant declination in J2000.0 coordinates; this process in practice took 4-7 seconds.
Observations in the L-band require mitigation of strong radio frequency interference (RFI; used here to mean any non-cosmic signal), both transient and persistent. Each individual polarization/ beam spectral drift scan was run through a peak-finding RFI flagging routine and then examined by an expert who could accept or reject the pipelined flags and/or set additional ones. While laborious, this procedure of data flagging produced a spectral mask that maintains a record of flagged spectral pixels that can be downloaded as an ancillary data file, important for identifying RFI “holes” in the 21 cm line sky, as the spectrum at each grid point is associated with a spectral weight at each frequency/velocity point. These weights are given and discussed in detail in Haynes et al 2018, Martin et al. 2010, and Giovanelli et al. 2007. [DATA LINKS].
The strongest and most persistent RFI feature arises from the FAA radar at the San Juan airport centered near 1350 MHz, and with out-of-band features sometimes detected at 1380, 1405 and 1410 MHz. Another common strong source of RFI occurs at 1381 MHz coming from periodic tests of the NUclear DETonation (NUDET) detection system aboard the global positioning system (GPS) satellites (the “GPS L3 signal”).
Upon acquisition of all of the drift scans covering a region of sky, all of the relevant spectra were combined to produce a 2.4 degree by 2.4 degree 3D spectral grid (full details of the process are given in Appendix A.2 of Haynes et al. 2018).
Full discussion of the data products is given on the data products page. This includes the catalog and its associated 1-d spectra and the data cubes, as well as relevant supporting documentation.